Draft Truth Series Vol. 1 - How Much Does Draft Capital Actually Matter?
Draft capital matters more than most fantasy managers want to admit. Across 1,034 skill-position players from the 2010-2022 draft classes, Round 1 players hit Top 24 at a 67% rate while Day 3 players hit just 11%, and wide receivers are the hardest position to bet on at every draft tier.

The Draft Truth Series focuses on data trends that can inform your general draft strategy and shift your thinking. You can also listen to our companion podcast episode on Apple Podcasts, Spotify, Amazon, or Acast.
We went through thirteen years of NFL draft data to answer one question: How much does draft capital actually matter for fantasy football?
The answer is sharper than most people expect. There's a clear point in the draft where hit rates collapse. Even at the very top (Round 1, picks with guaranteed starting roles) players fail more often than the hype suggests. And wide receivers? They're the worst bet at every level of draft capital. If you play dynasty, evaluate rookies, or chase value in any format, these numbers should change how you think about players.
1. What People Believe
Before the data, let's name the assumptions most fantasy players carry:
-
Belief #1: Draft capital equals talent. If a player goes early, the NFL clearly believes in them. Scouts studied them. GMs staked their reputations. So they must be better.
-
Belief #2: The late-round steal is the holy grail. Day 3 guys who break out are the ultimate flex. Everyone wants to be the person who says they saw Puka Nakua or Tyreek Hill coming.
-
Belief #3: Landing spot overrides everything. Guy goes to a great offense with a great quarterback? Hype train leaves immediately. Draft position gets discounted because "situation matters more."
Here's the problem- most of this is based on vibes, not outcomes. Nobody stops to ask: what actually happens, historically, to players at each draft position? How do the odds change by position?
We did.
2. How We Looked at it
We kept this simple. We pulled every skill-position player drafted in the 2010 through 2022 NFL Drafts (that's 1,034 players across 13 classes.) Every player in this window has a complete three-year evaluation window. No partial samples. No recency bias. We defined success in four tiers:
| Tier | Threshold | What it means |
|---|---|---|
| Elite | Top 12 at position | Weekly starter in any format |
| Starter | Top 24 | Startable in most leagues |
| Usable | Top 36 | Streaming / flex option |
| Bench Stash | Top 50 | Holds some value |
One question: Did they reach this threshold in any of their first three NFL seasons? Not "did they sustain it." Not "were they a Pro Bowler." Just: did they become fantasy relevant at all in that window? We ran this for QBs, RBs, WRs, and TEs because these positions develop on very different timelines.
3. What the Data Shows
The headline numbers
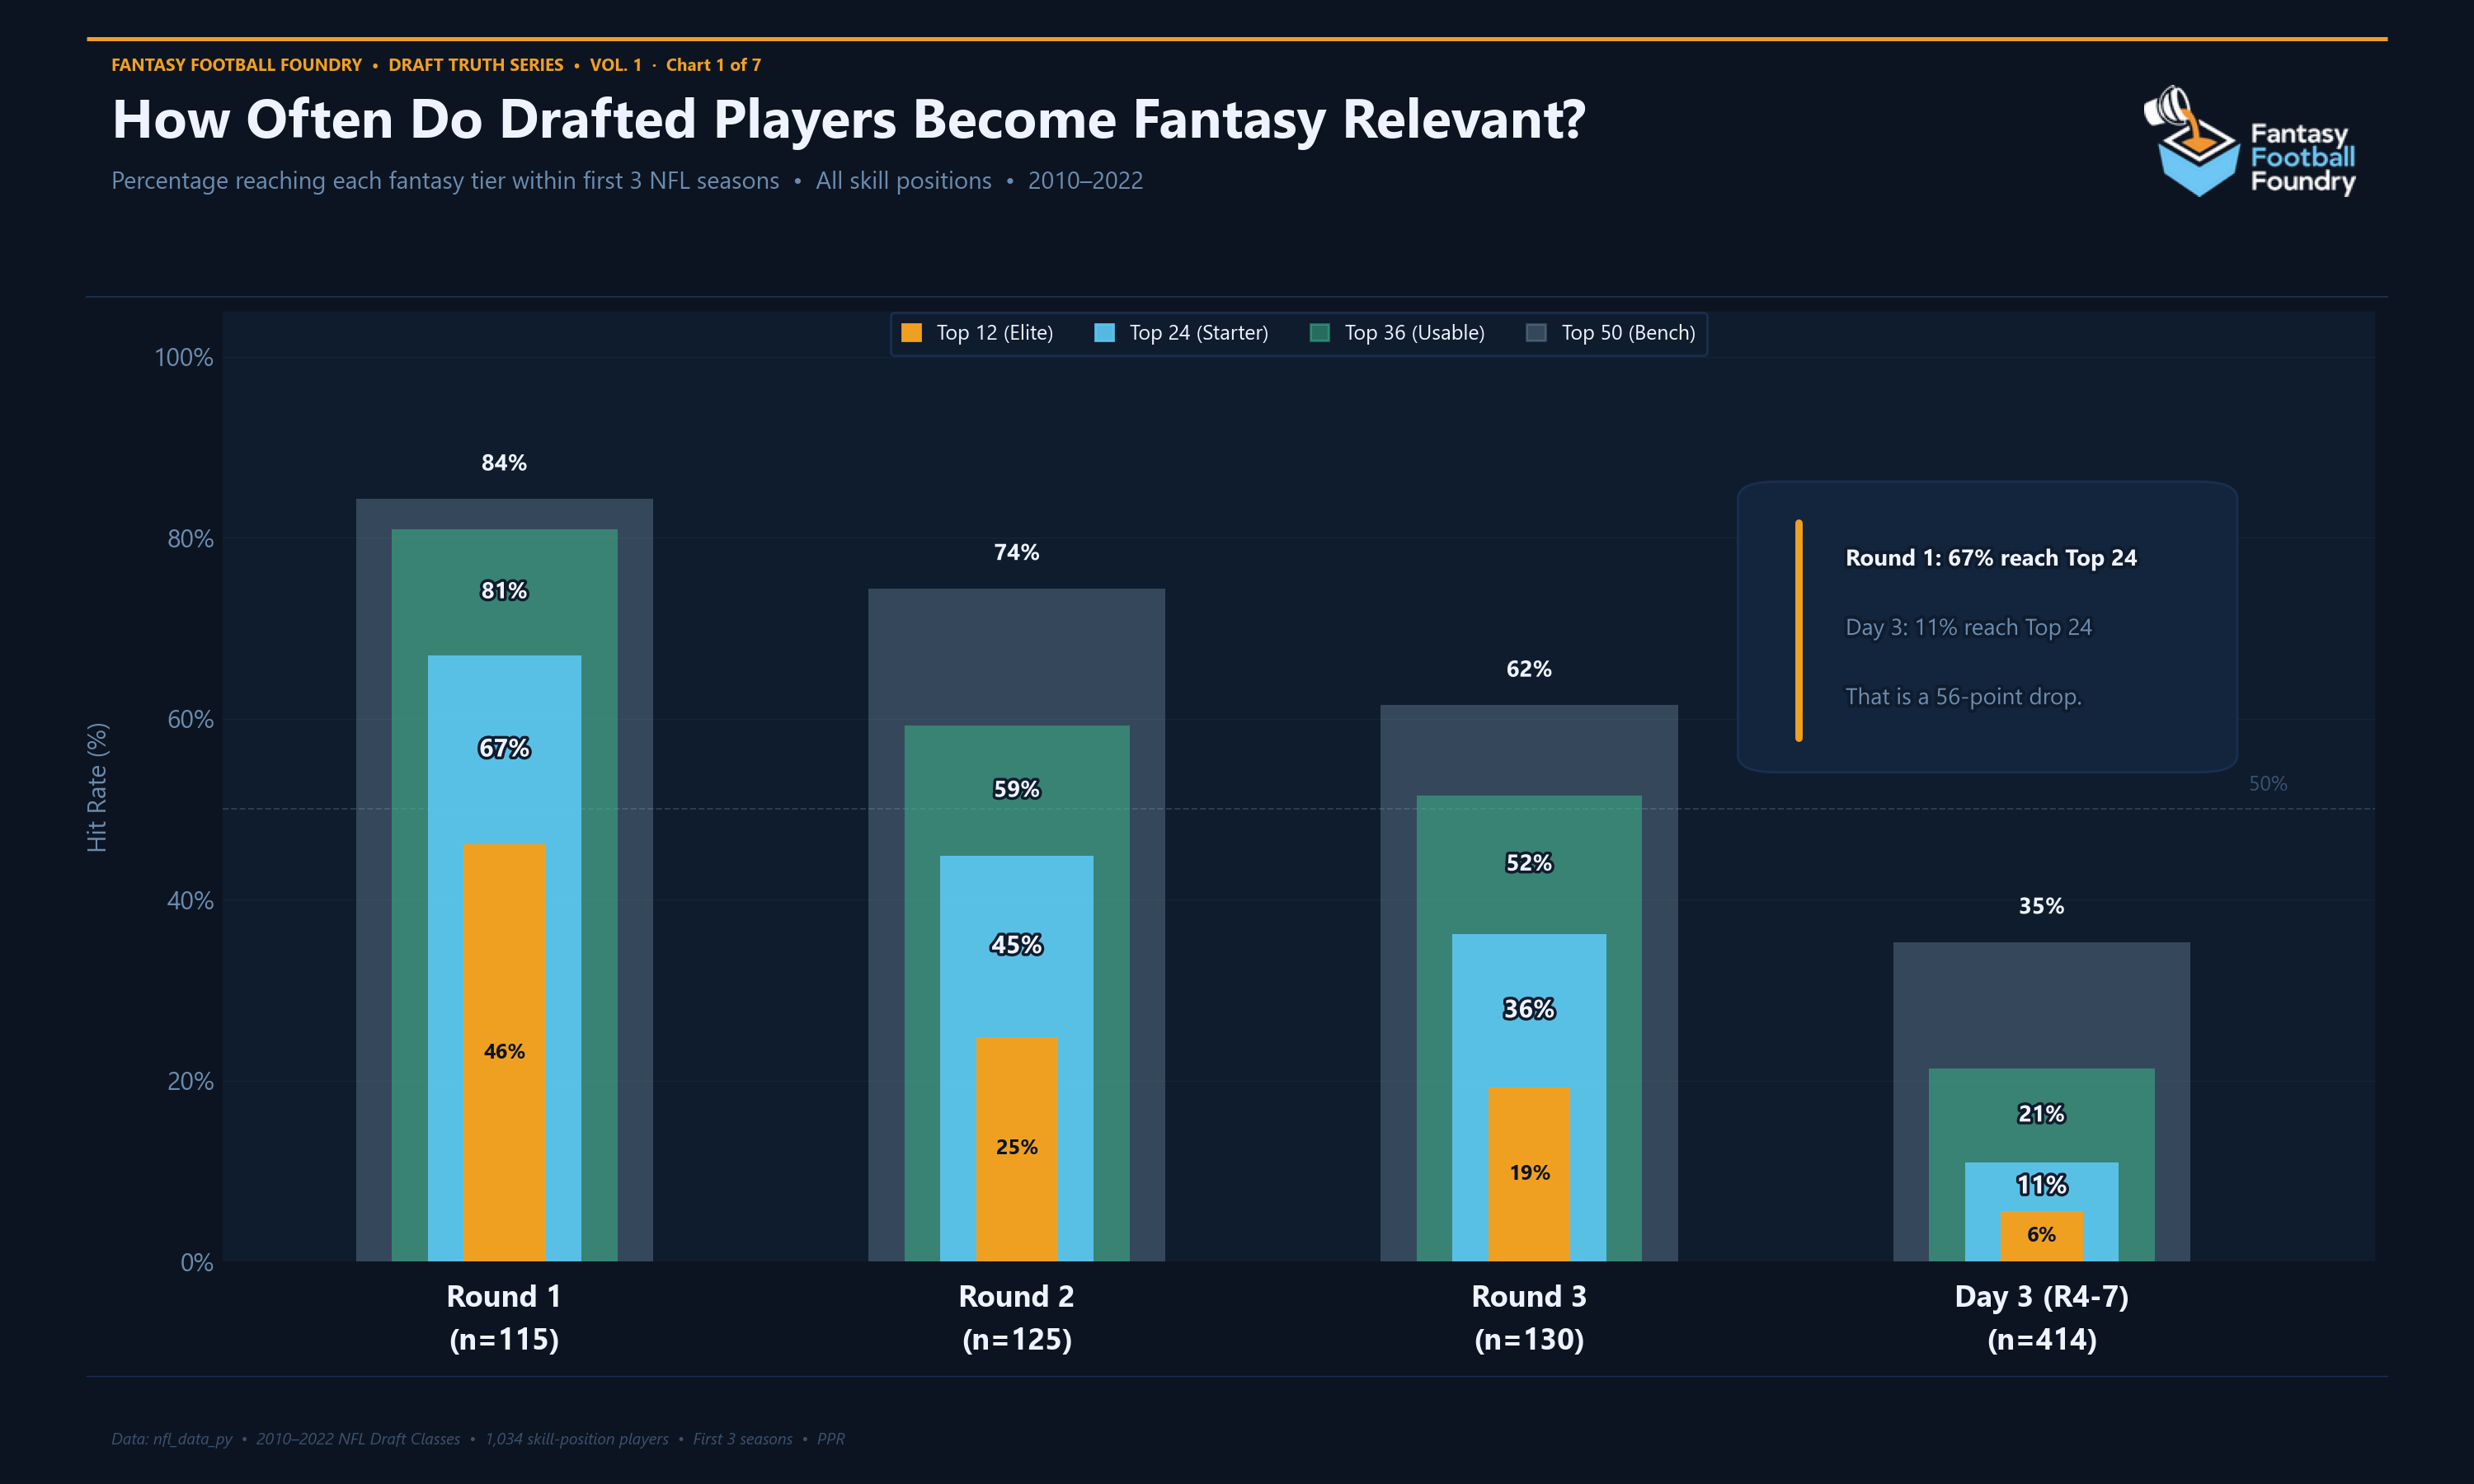
Across all skill positions, the full picture:
- Round 1 (n=115):
- 67% become top-24 players.
- 46% hit top-12.-
- Round 2 (n=125):
- 45% become top-24.
- 25% hit top-12.-
- Round 3 (n=130):
- 36% become top-24.
- 19% hit top-12.-
- Day 3, Rounds 4-7 (n=414):
- 11% become top-24.
- Just 6% hit top-12.
Three things jump out:
- First: even Round 1 doesn't guarantee a starter. One in three first-round skill players never becomes a top-24 option in their first three years. The most celebrated, most scouted players in the country — and a third of them wash out of fantasy relevance before Year 3.
- Second: the drop from Round 1 to Round 2 is steeper than most people realize. 67% to 45%. This is a 22-point fall. Round 2 to Round 3 loses another 9 points. Round 3 to Day 3 is the cliff: 25 more points, landing at 11%.
- Third: Day 3 is nearly a non-starter for elite production. 6% top-12 hit rate. For every Tyreek Hill (pick #165), there are roughly sixteen Day 3 skill players who never become fantasy starters.
Where the cliff is
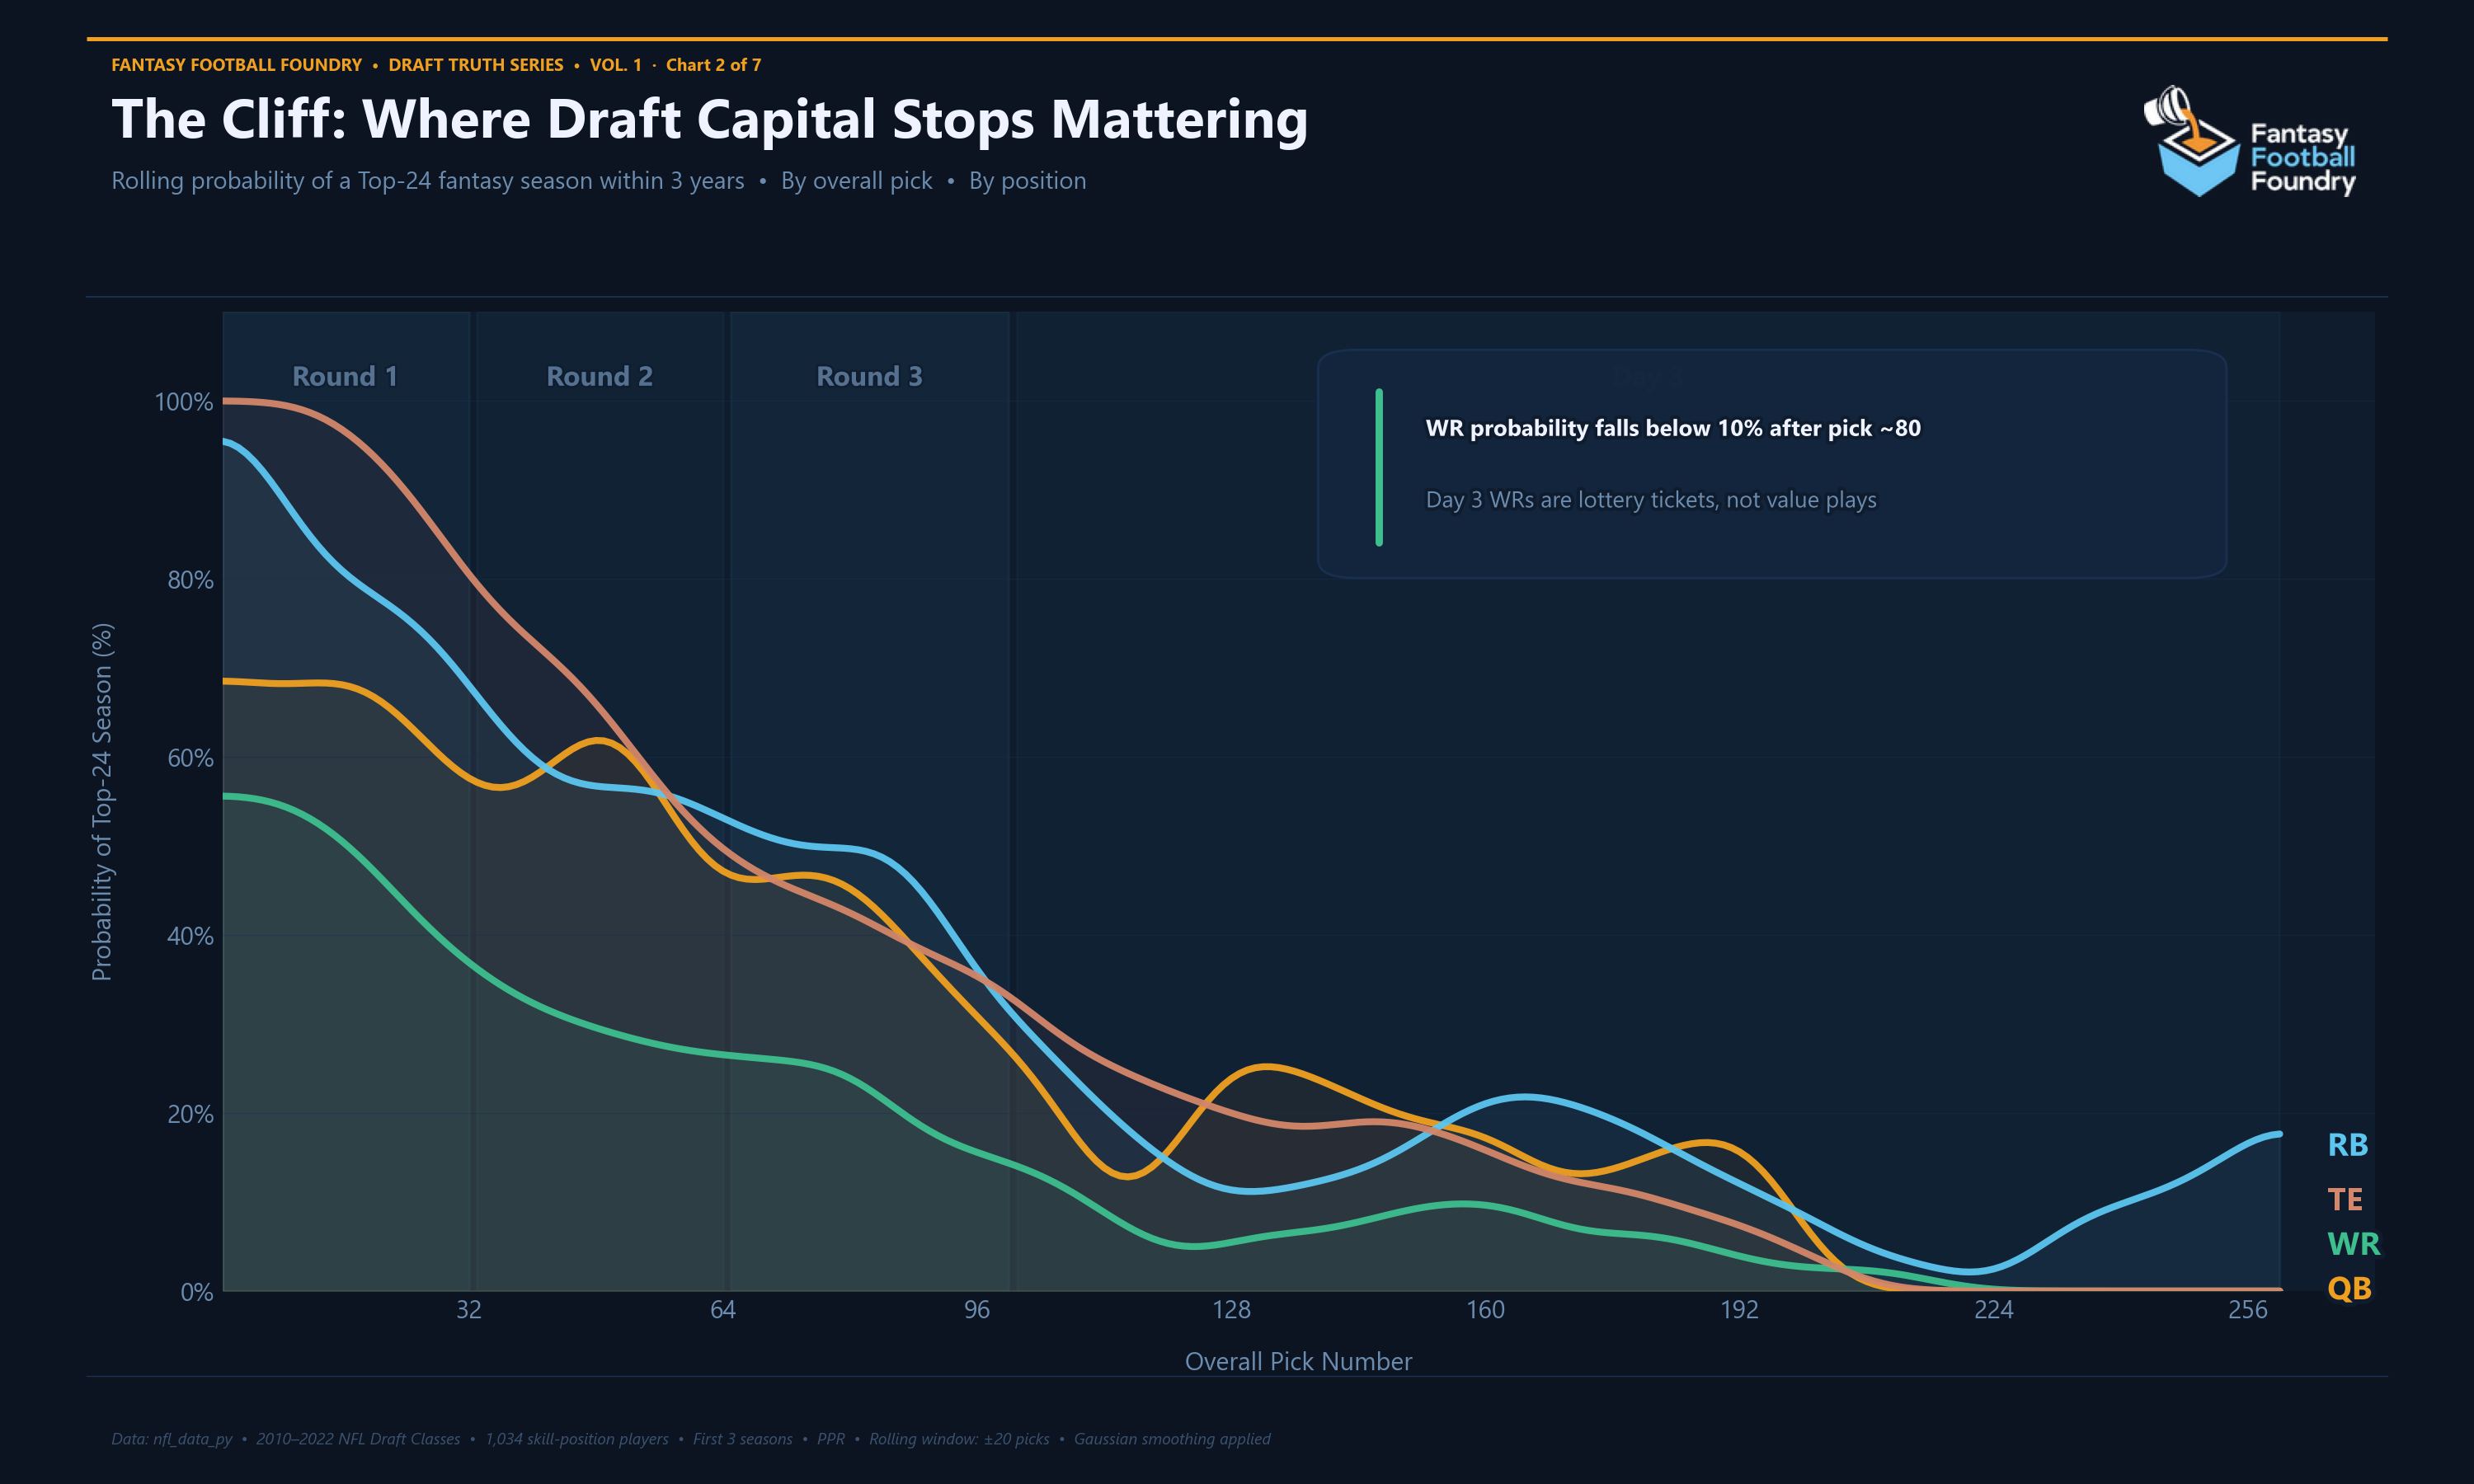
Chart 2 plots the rolling probability of a top-24 fantasy season against overall pick number, position by position. It shows exactly where the probability breaks down. The answer depends on where you play:
-
QBs hold near 60–70% through the first two rounds, then fall. Day 3 QBs sit at 16% — though outliers like Brock Purdy (pick #262) and Dak Prescott (pick #135) pull that number up from where it would otherwise live.
-
RBs peak highest at the top of Round 1 — nearly 79% of first-round backs become fantasy starters — but the curve drops sharply after that. Running back value is opportunity-driven, and top draft capital is the best predictor of getting that opportunity fast.
-
WRs are the most striking line on the chart. Their probability curve sits below every other position at nearly every pick range. Even in Round 1, WR hit rate is the lowest of any skill position. After pick 80, WR probability falls below 10% and stays there.
-
TEs show an unusual curve — a sustained climb through the mid-rounds that reflects the position's longer development runway.
The position breakdown
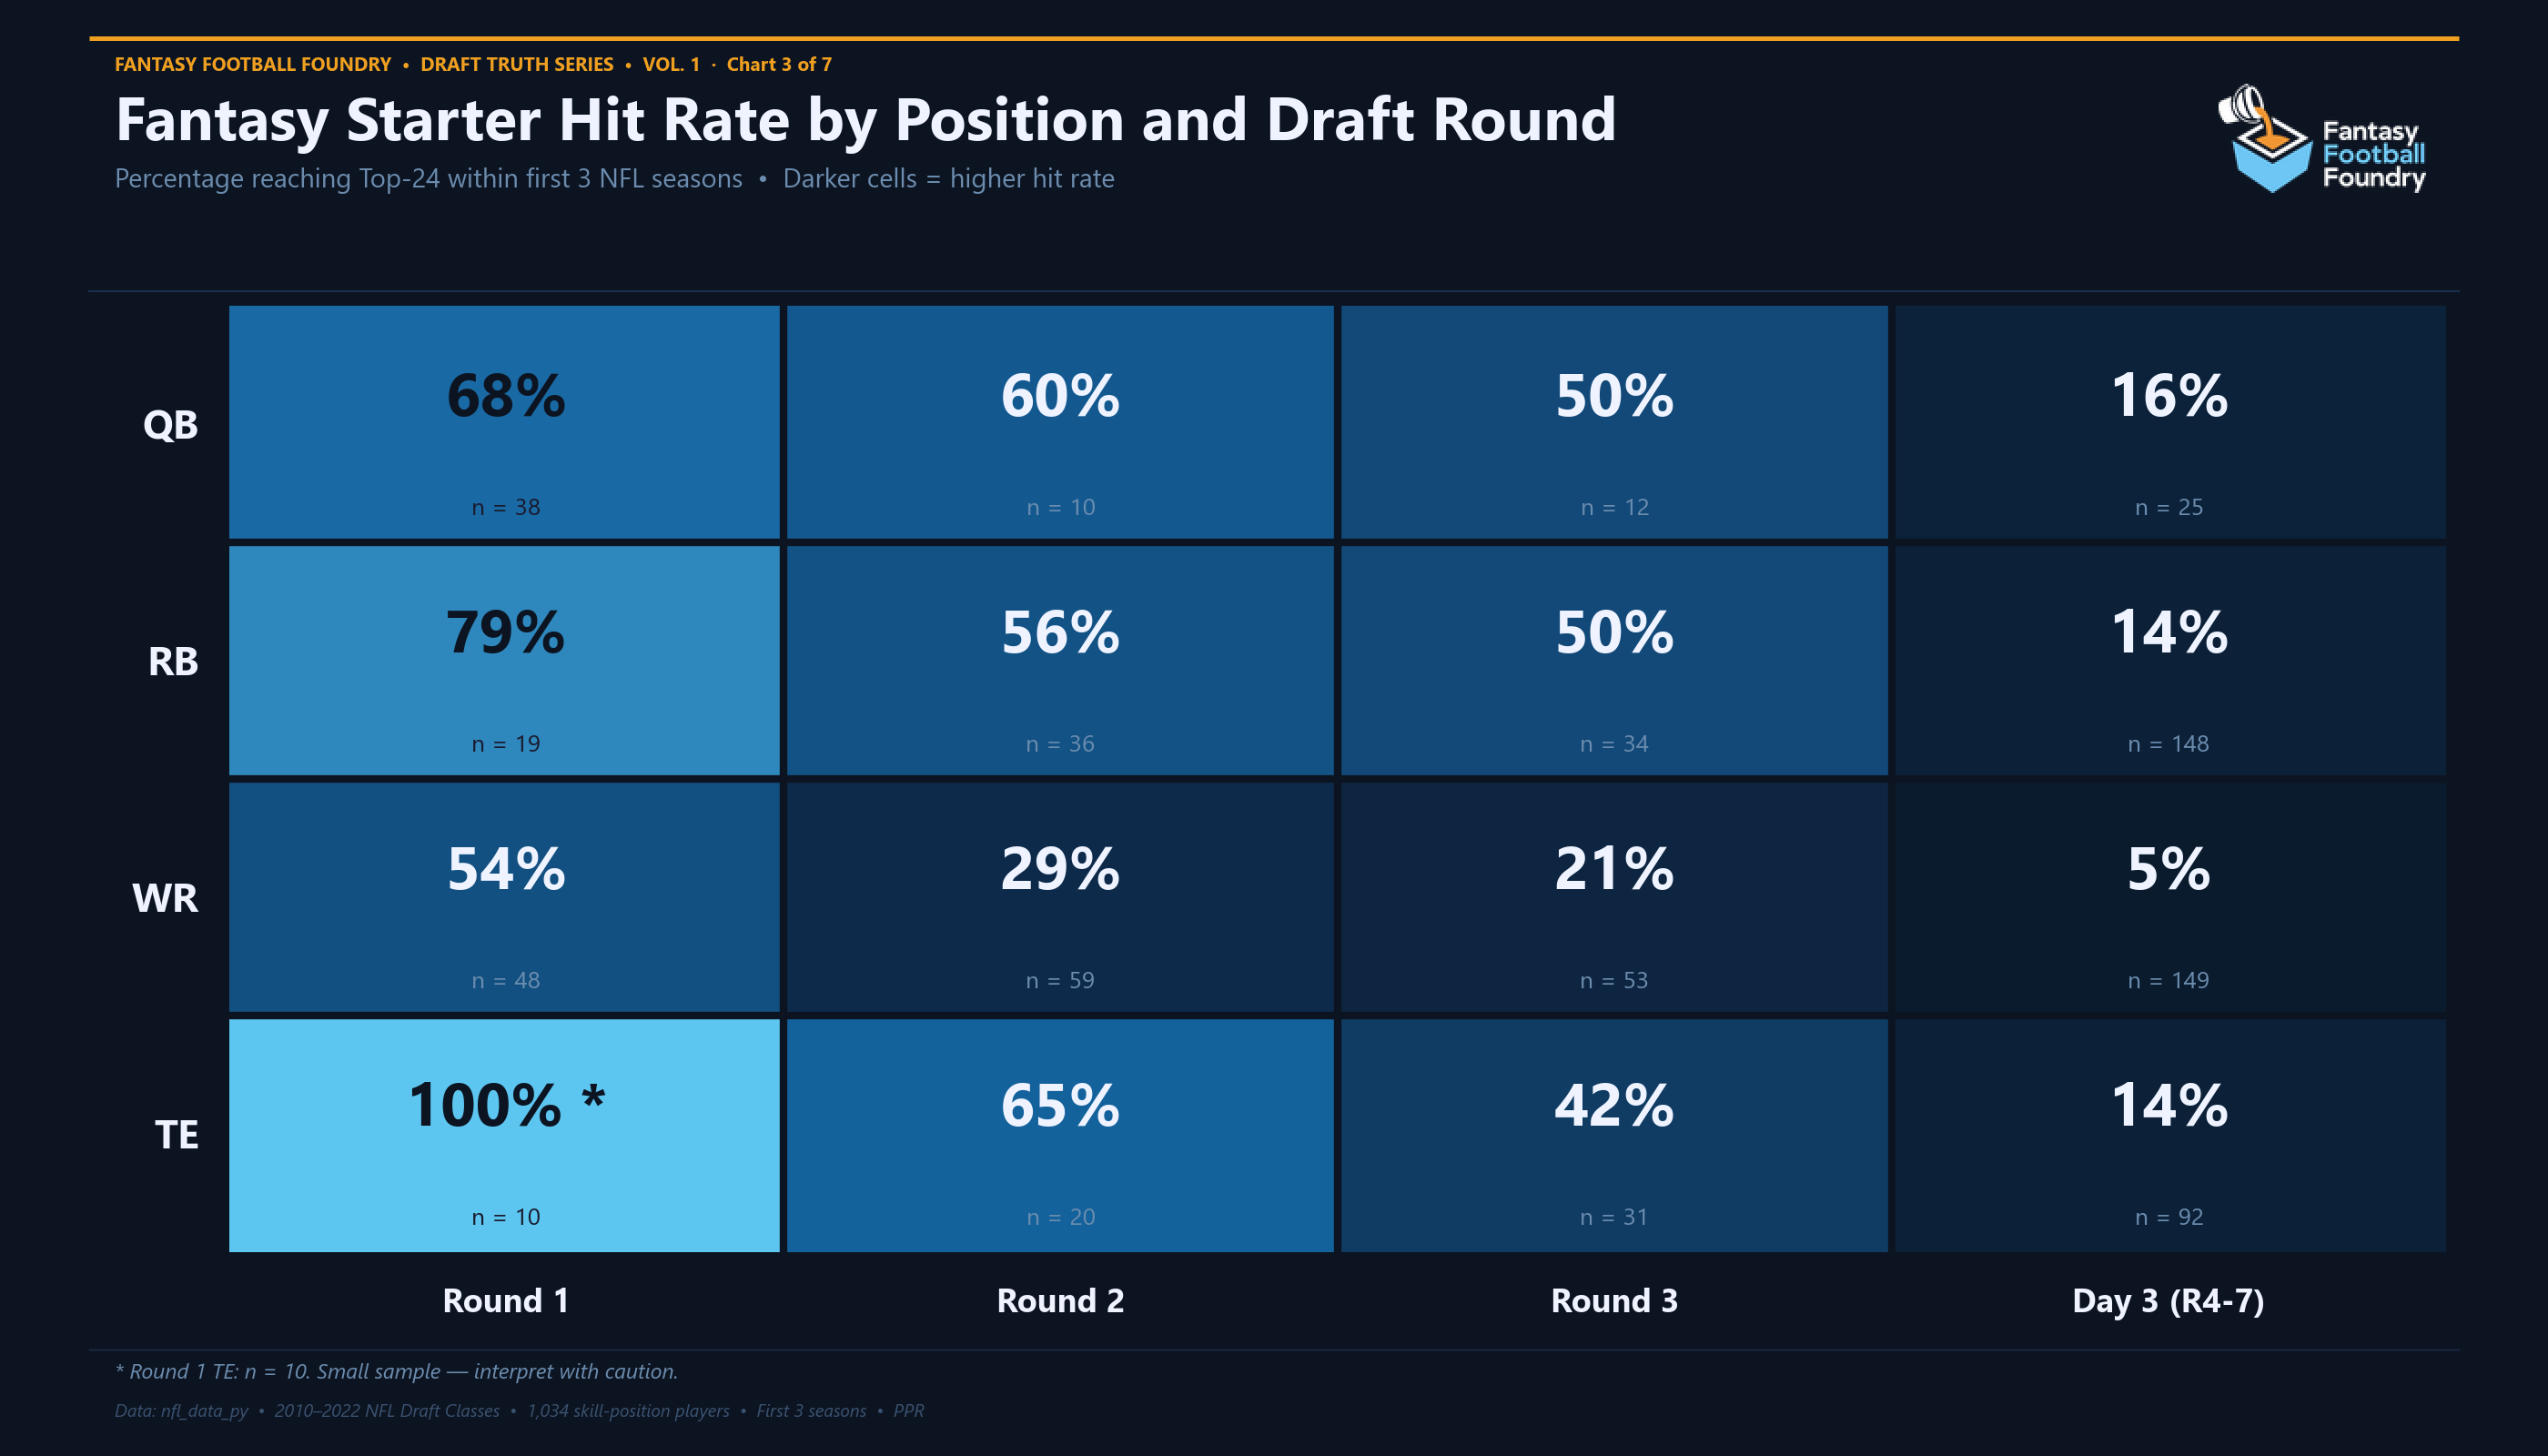
This heatmap is where the position-specific stories get sharp.
QBs are highly draft-capital dependent. Round 1 QBs hit top-24 at 68%. Round 2 at 60%. Still meaningful in Round 3 at 50%. Day 3 collapses to 16% — propped up by genuine exceptions (Prescott, Purdy), not a repeatable pattern.
RBs in Round 1 hit top-24 at 79%. The highest of any non-TE skill position. Round 2 drops to 56%, Round 3 to 50%, and Day 3 to 14%. The falloff from Round 1 is steep.
WRs are the most sobering line at every level. Round 1 WRs hit top-24 at just 54% — barely over half. A coin flip on a first-round receiver becoming a reliable starter. Round 2 drops to 29%. Round 3 to 21%. Day 3: 5%. Nineteen out of twenty Day 3 WRs never become fantasy starters.
TEs show the strongest Round 1 rate in the data. Round 1 TEs hit top-24 at 100% (n=10; small sample, interpret with caution). Round 2 at 65%. Round 3 at 42%. Day 3 at 14%. The absolute floor is higher than WRs at every level.
When do they actually break out?
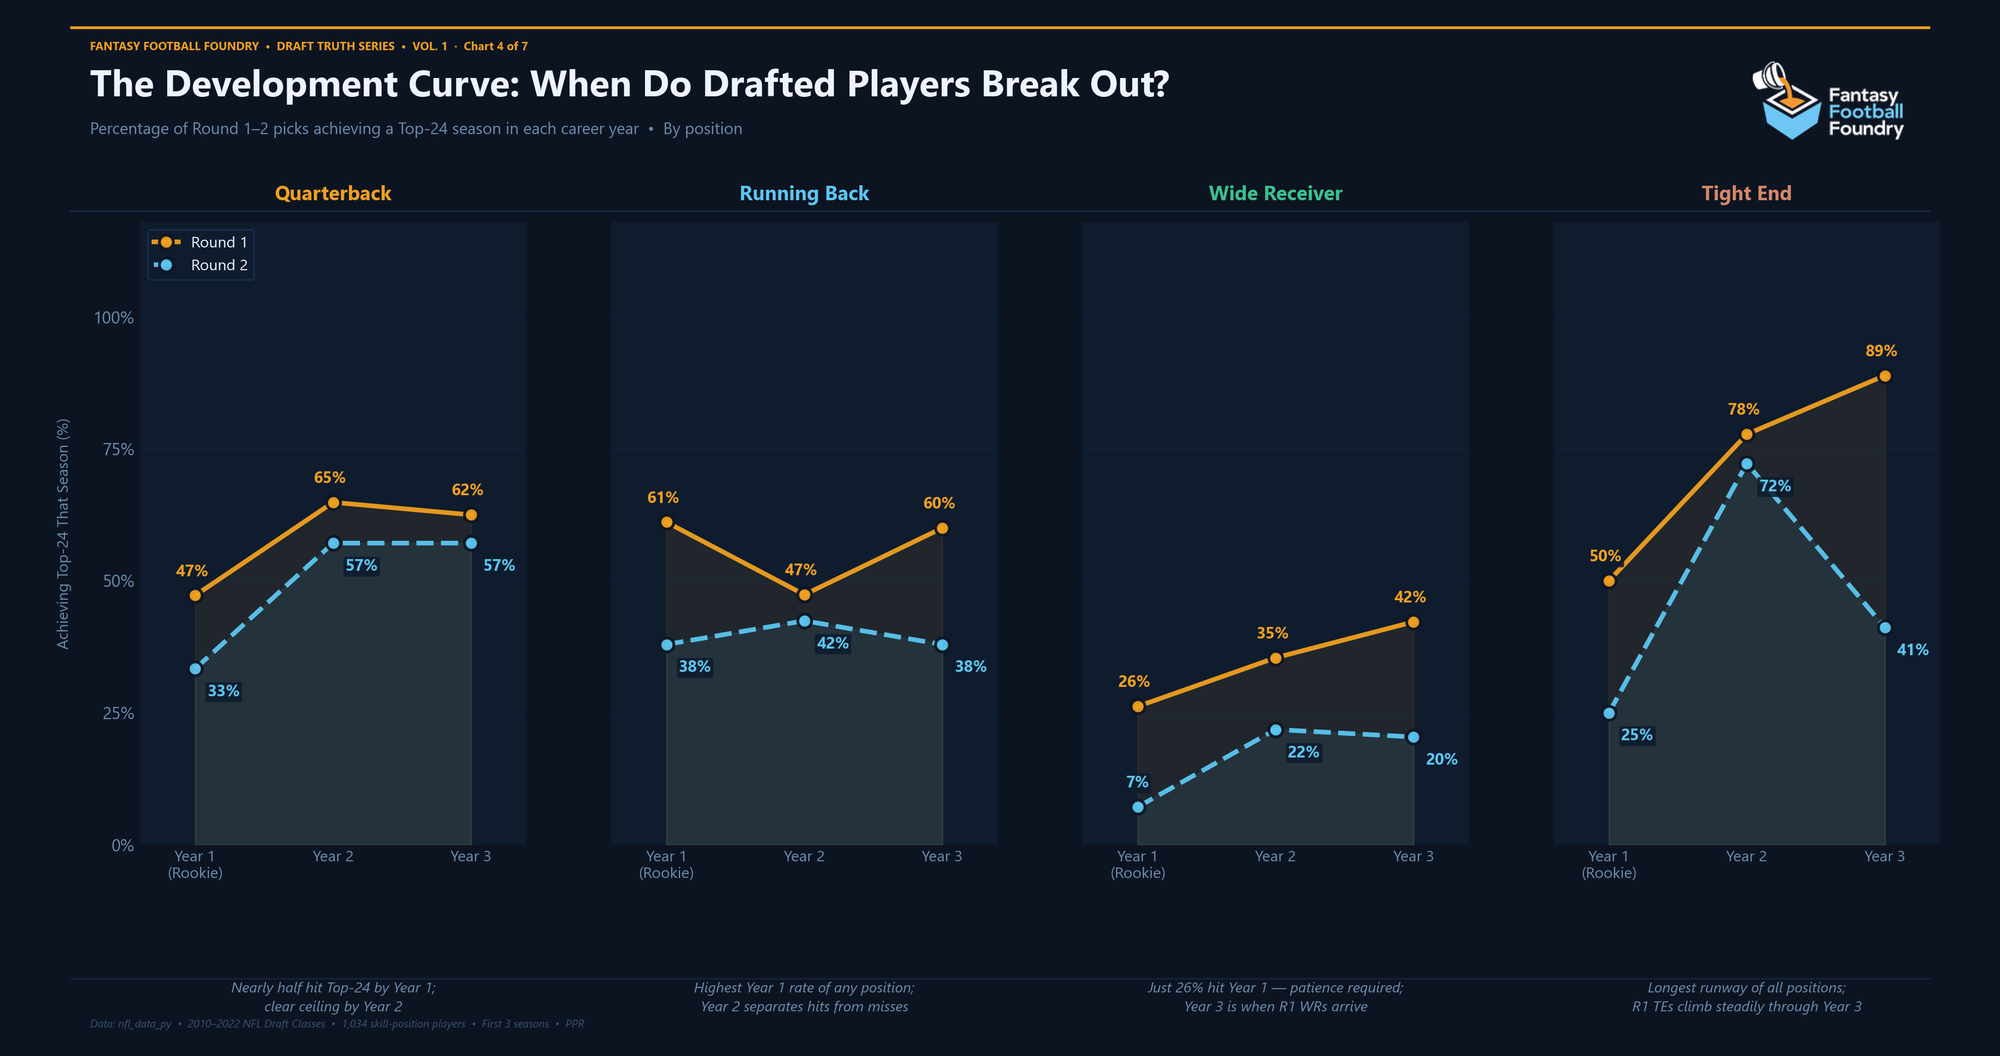
Chart 4 is the chart that should change how you handle rookie dynasty acquisitions. For each position, we tracked what percentage of Round 1-2 picks hit top-24 in Year 1, Year 2, and Year 3 specifically.
QBs develop fast. 47% of Round 1 QBs hit top-24 in Year 1, climbing to 65% by Year 2 and holding at 63% in Year 3. The learning curve at quarterback is real but short.
RBs produce immediately or they don't. 61% of Round 1 backs hit top-24 as rookies (the highest Year 1 rate of any position.) Year 2 dips to 47% (injuries, committee shifts), then recovers to 60% in Year 3. If a first-round back isn't producing by Year 2, the window may already be closing.
Wide receivers need time and the data proves it.
Round 1 WRs hit top-24 at just 26% in Year 1, climbing to 35% in Year 2, and reaching 42% by Year 3. If you're a dynasty player panicking that your first-round WR had a quiet rookie season, that is literally the expected outcome. It is not a bust signal. A development signal. Round 2 WRs are even slower: just 7% in Year 1.
Tight ends are the longest burn.
Round 1 TEs start at 50% in Year 1, jump to 78% in Year 2, and hit 89% by Year 3. The "Year 3 TE breakout" is real and structural. Round 2 TEs show a similar delayed arc: 25% in Year 1, spiking to 72% in Year 2 before settling at 41% in Year 3. If you're holding a Round 1-2 TE who hasn't broken out yet, Year 2-3 is the season to watch before making any decisions.
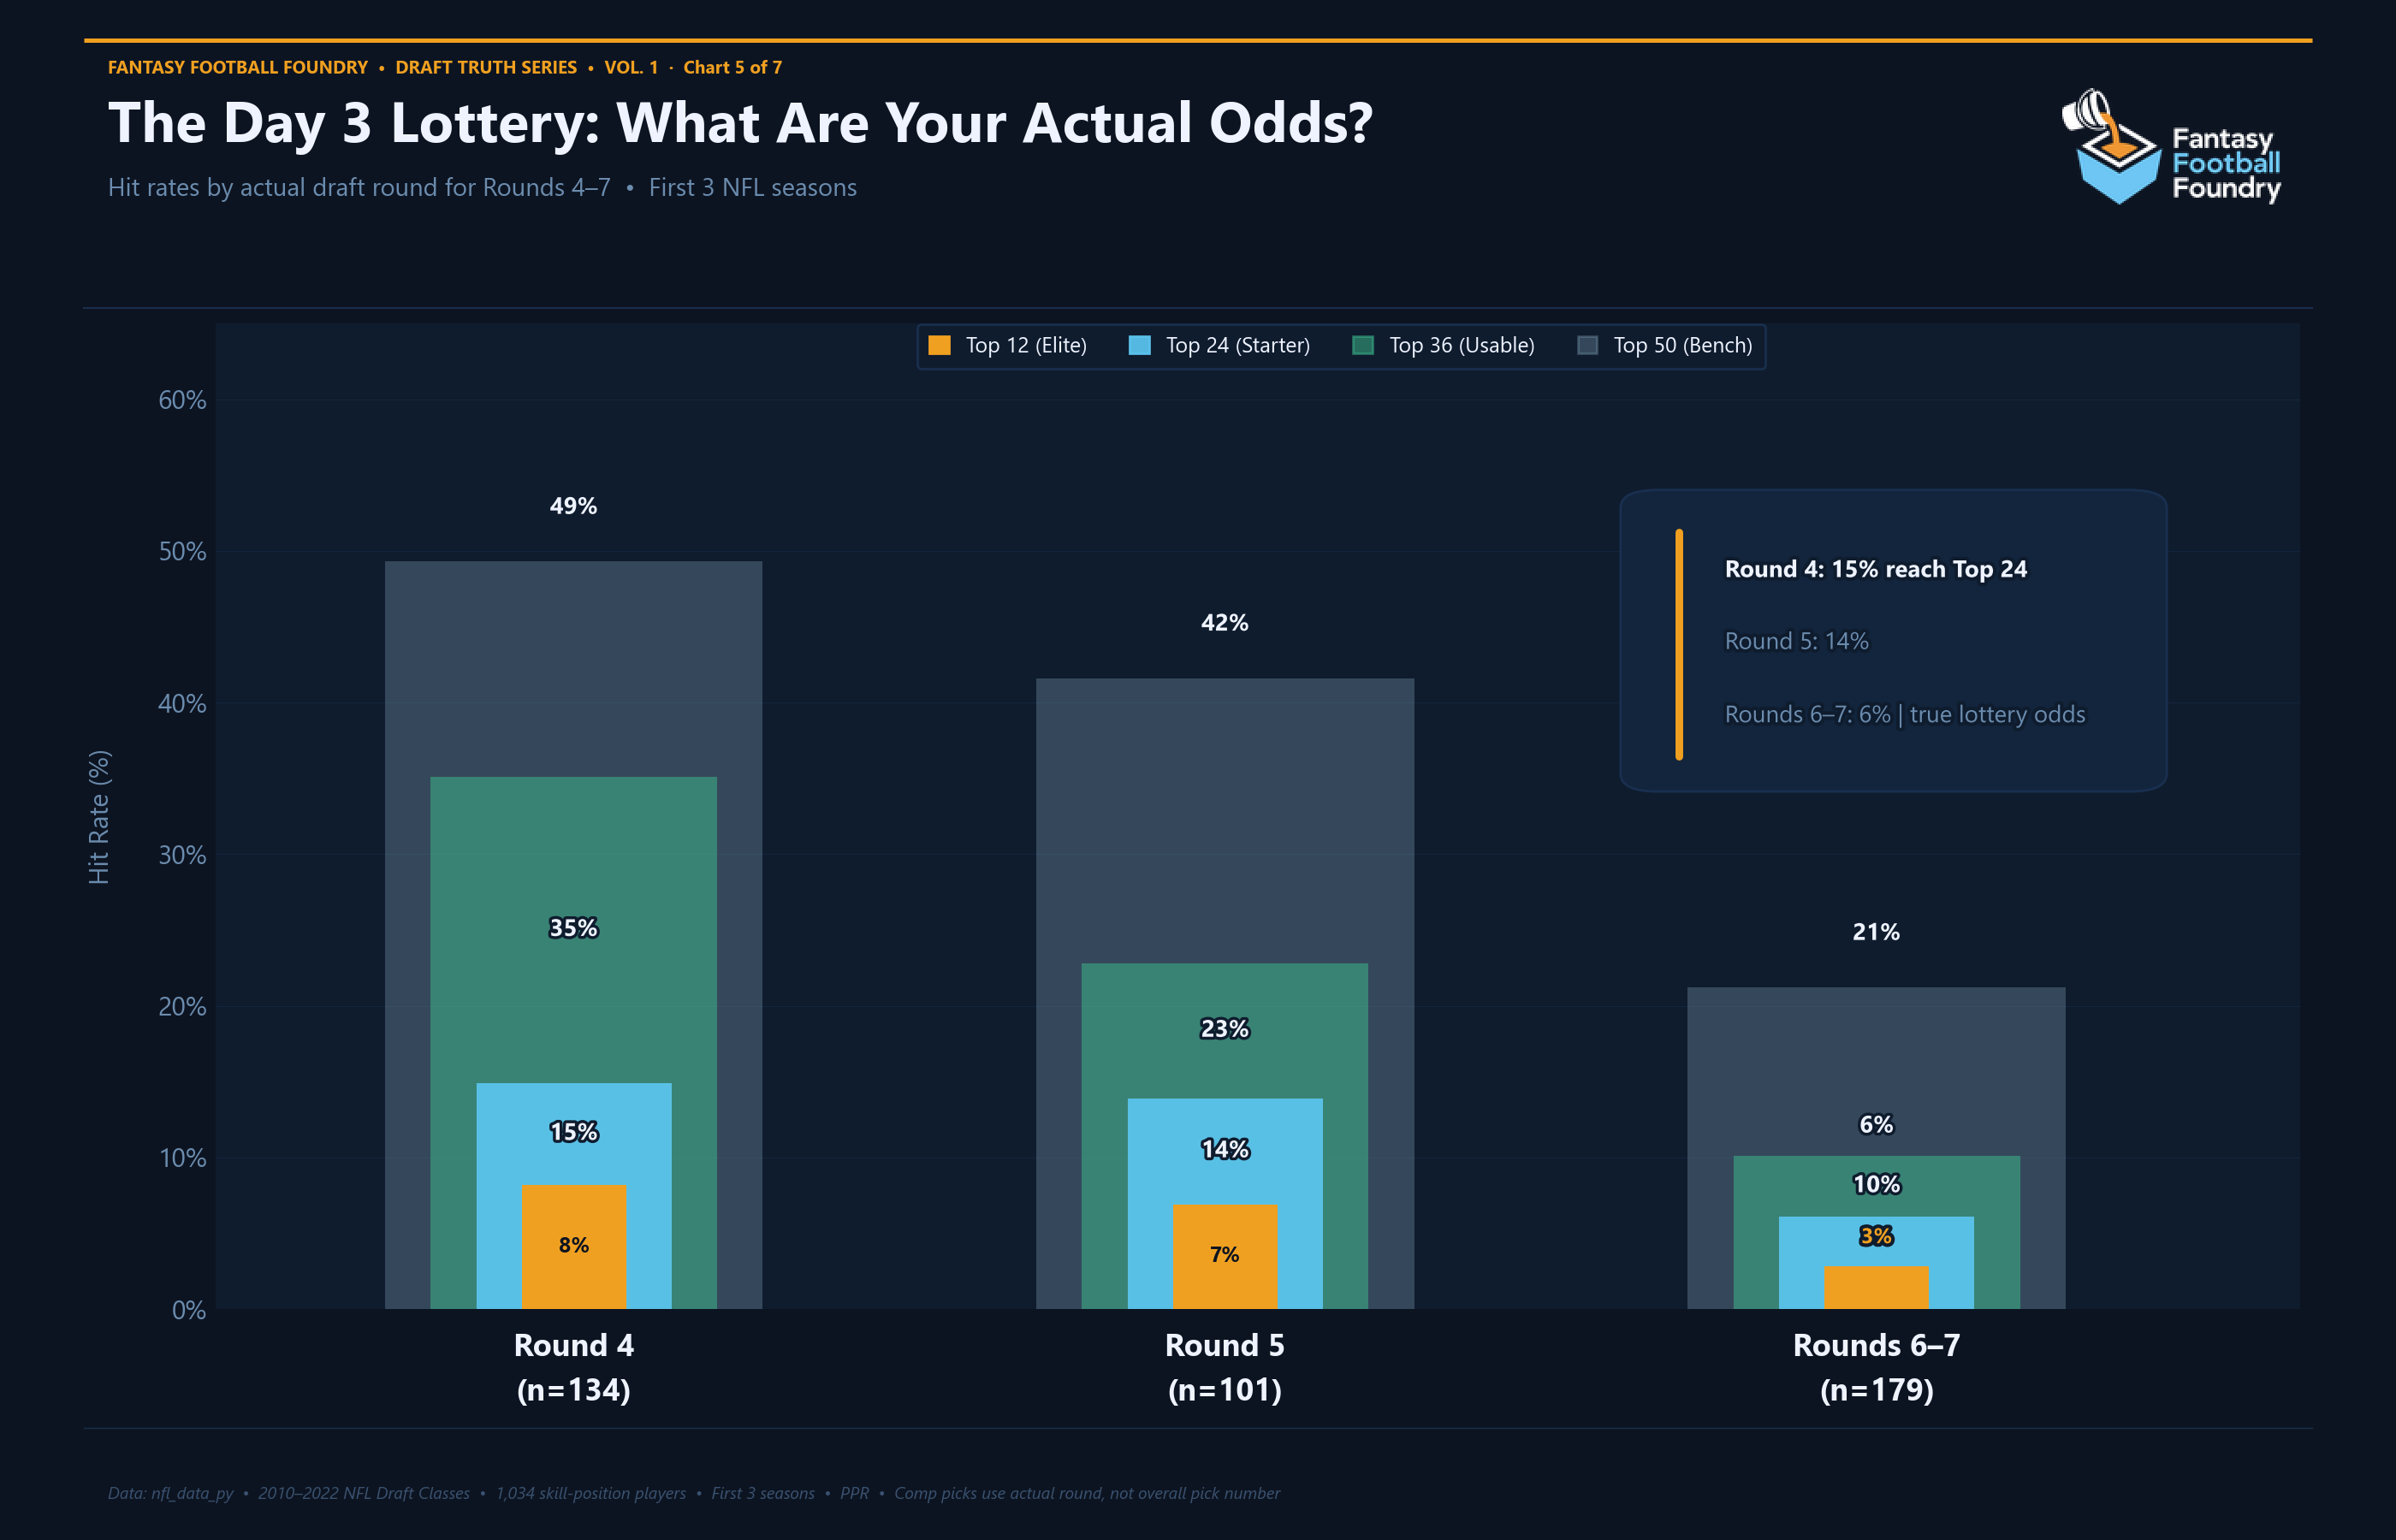
The Day 3 breakdown
Within Day 3, the drop-off continues, but the story is more nuanced than "all Day 3 picks are worthless."
Round 4 (n=134) is where you still find real players: 15% top-24 rate. This is the round that produced Devonta Freeman (pick #103), James Conner (#105), Amon-Ra St. Brown (#112), George Kittle (#146), Dak Prescott (#135), and Kyren Williams (#164). The hits are real, they're just outnumbered by the misses roughly 6-to-1.
Round 5 (n=101) holds at 14% top-24. Still a viable source of starters, but the elite rate drops further; just 7% reach top-12.
Rounds 6–7 (n=179) is where it falls apart: 6% top-24. You're playing true lottery odds. The players who beat those odds: Tyreek Hill (pick #165), Aaron Jones (#182), Brock Purdy (#262), Alfred Morris (#173), are genuine outliers, not a repeatable strategy.
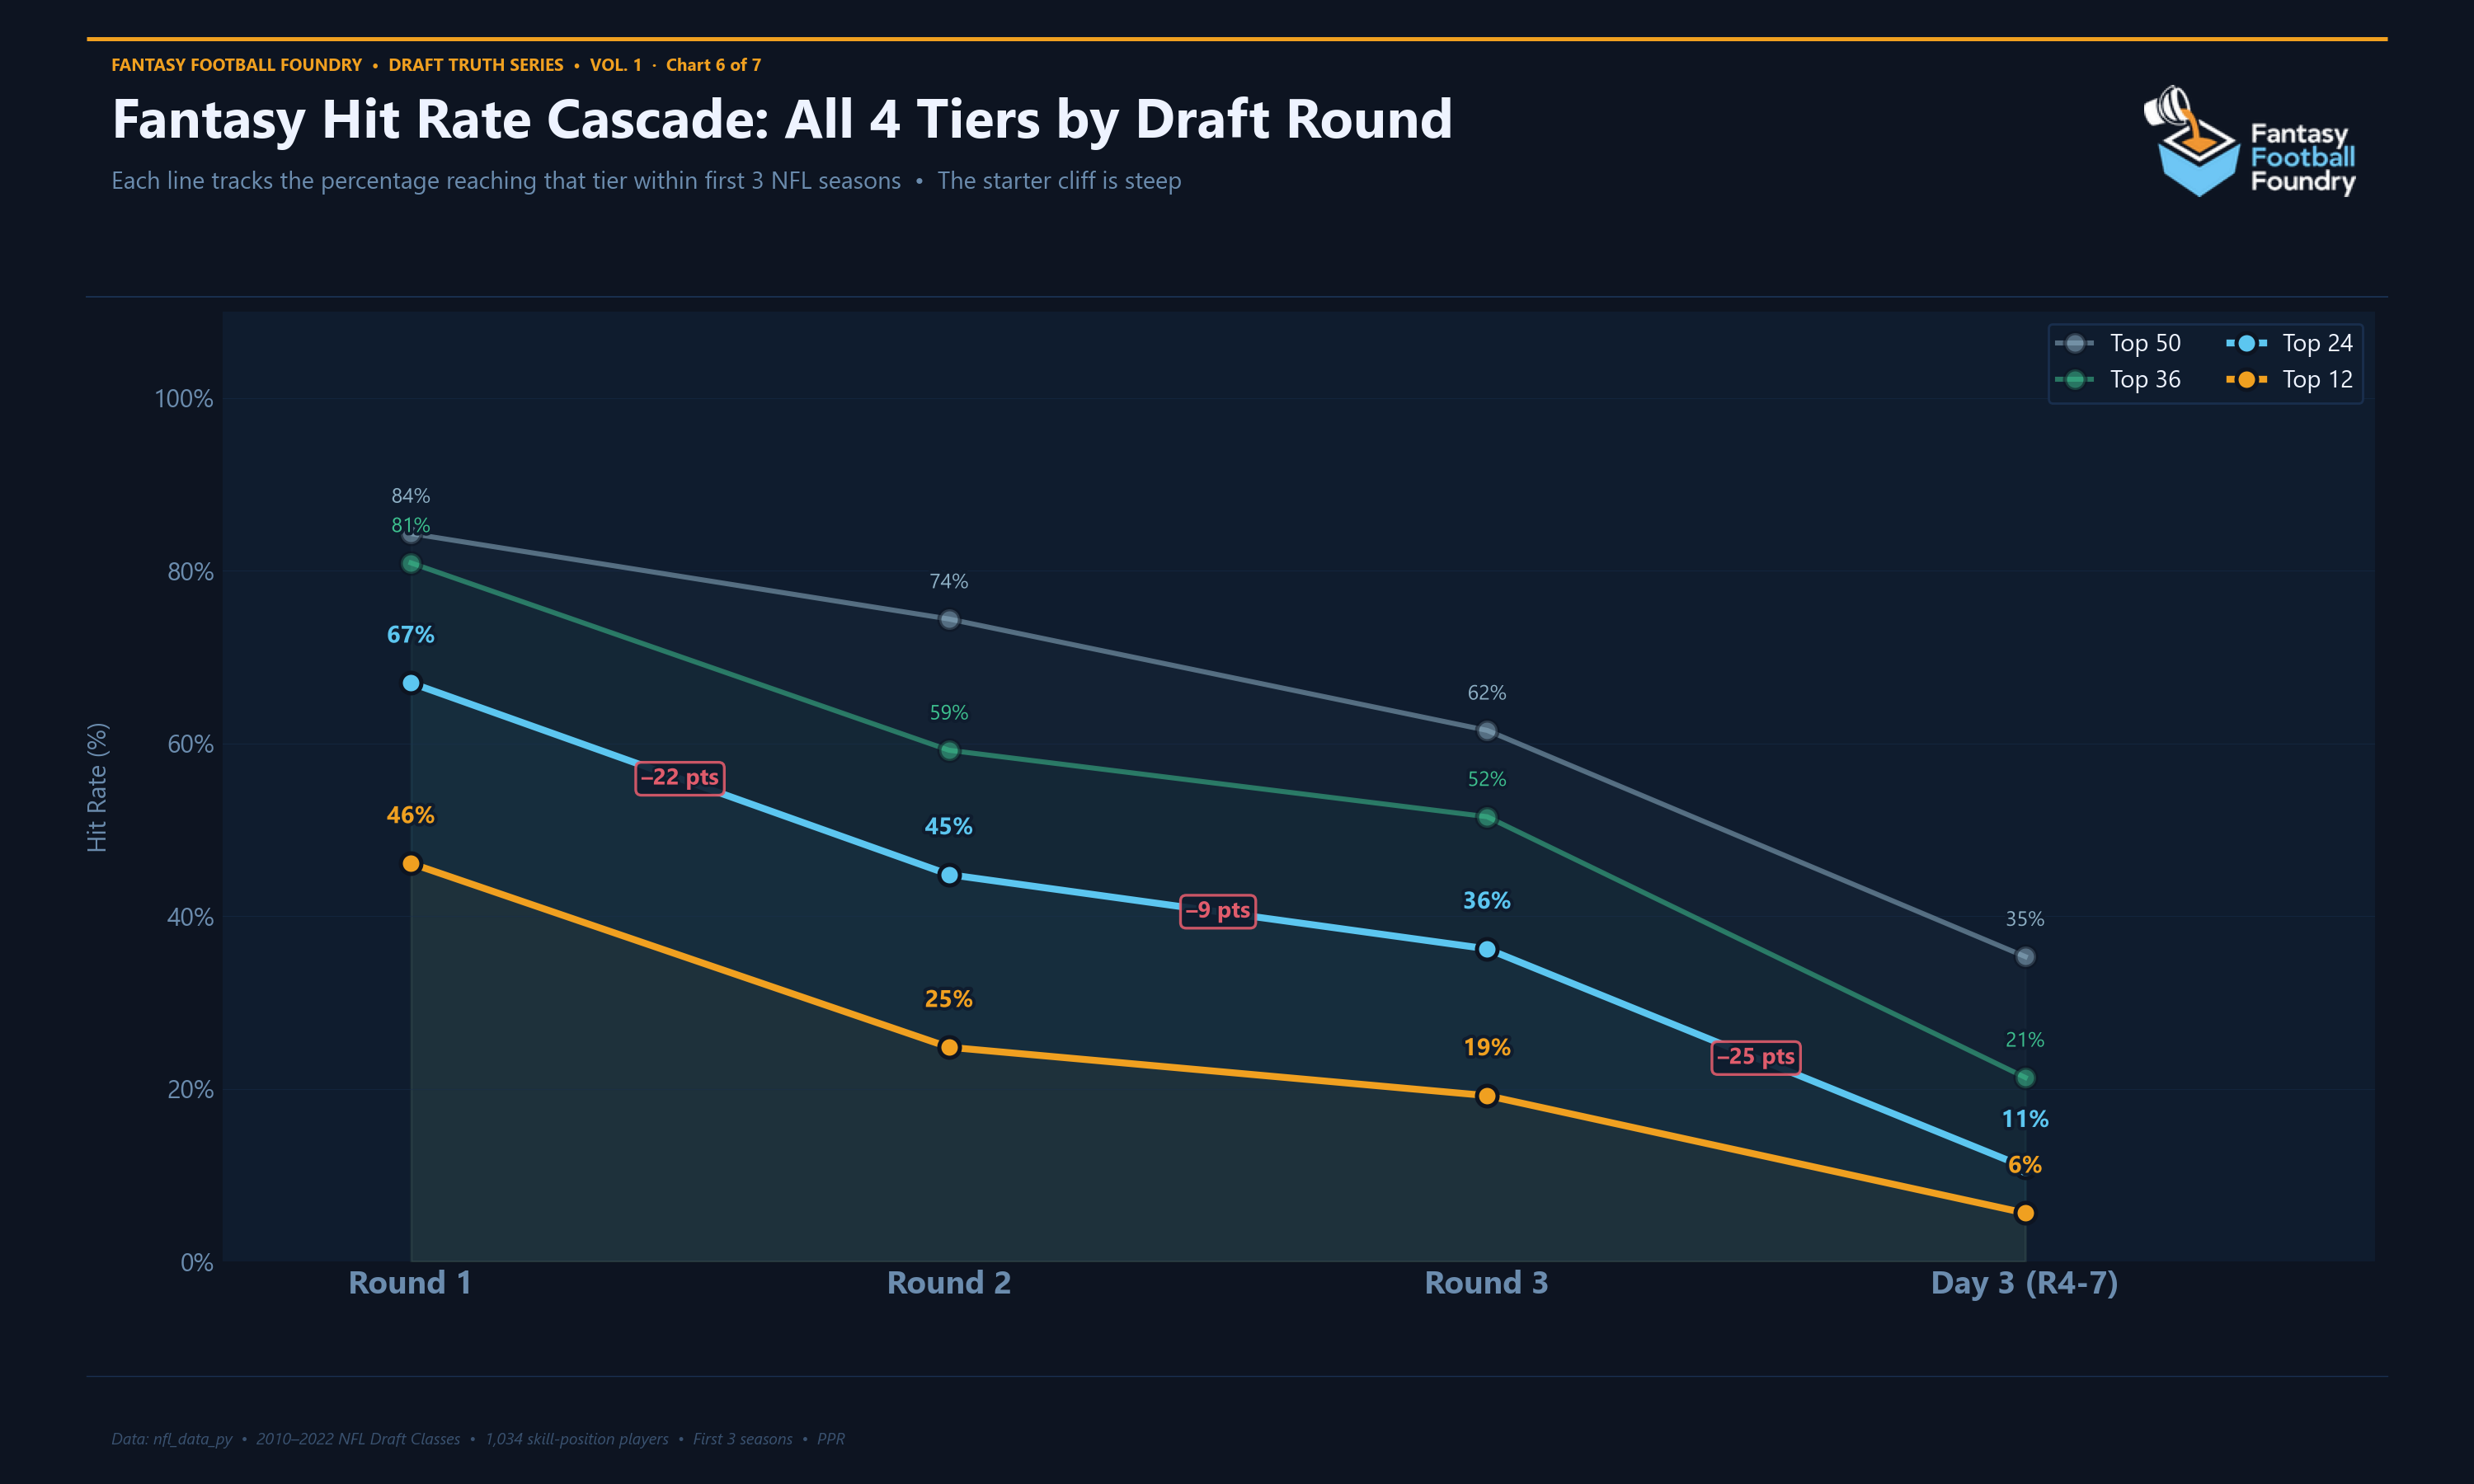
The tier cascade
The cascade chart shows all four tiers at once, mapped across draft rounds.
Every tier drops at roughly the same rate. The fall from Round 1 to Round 2 on the top-24 line is 22 percentage points. Round 2 to Round 3 is 9 more. Round 3 to Day 3 is the steepest: 25 points. By Day 3, even the "bench stash" tier (top 50) sits at just 35%. Two in three Day 3 skill players never become even a streaming option in fantasy.
The WR truth no one wants to hear
WRs get their own chart because the position demands its own frame.
Wide receivers are simultaneously:
- The most popular dynasty asset class
- The position with the lowest hit rate at every draft capital level
- The slowest-developing skill position
- The hardest to evaluate based on landing spot alone
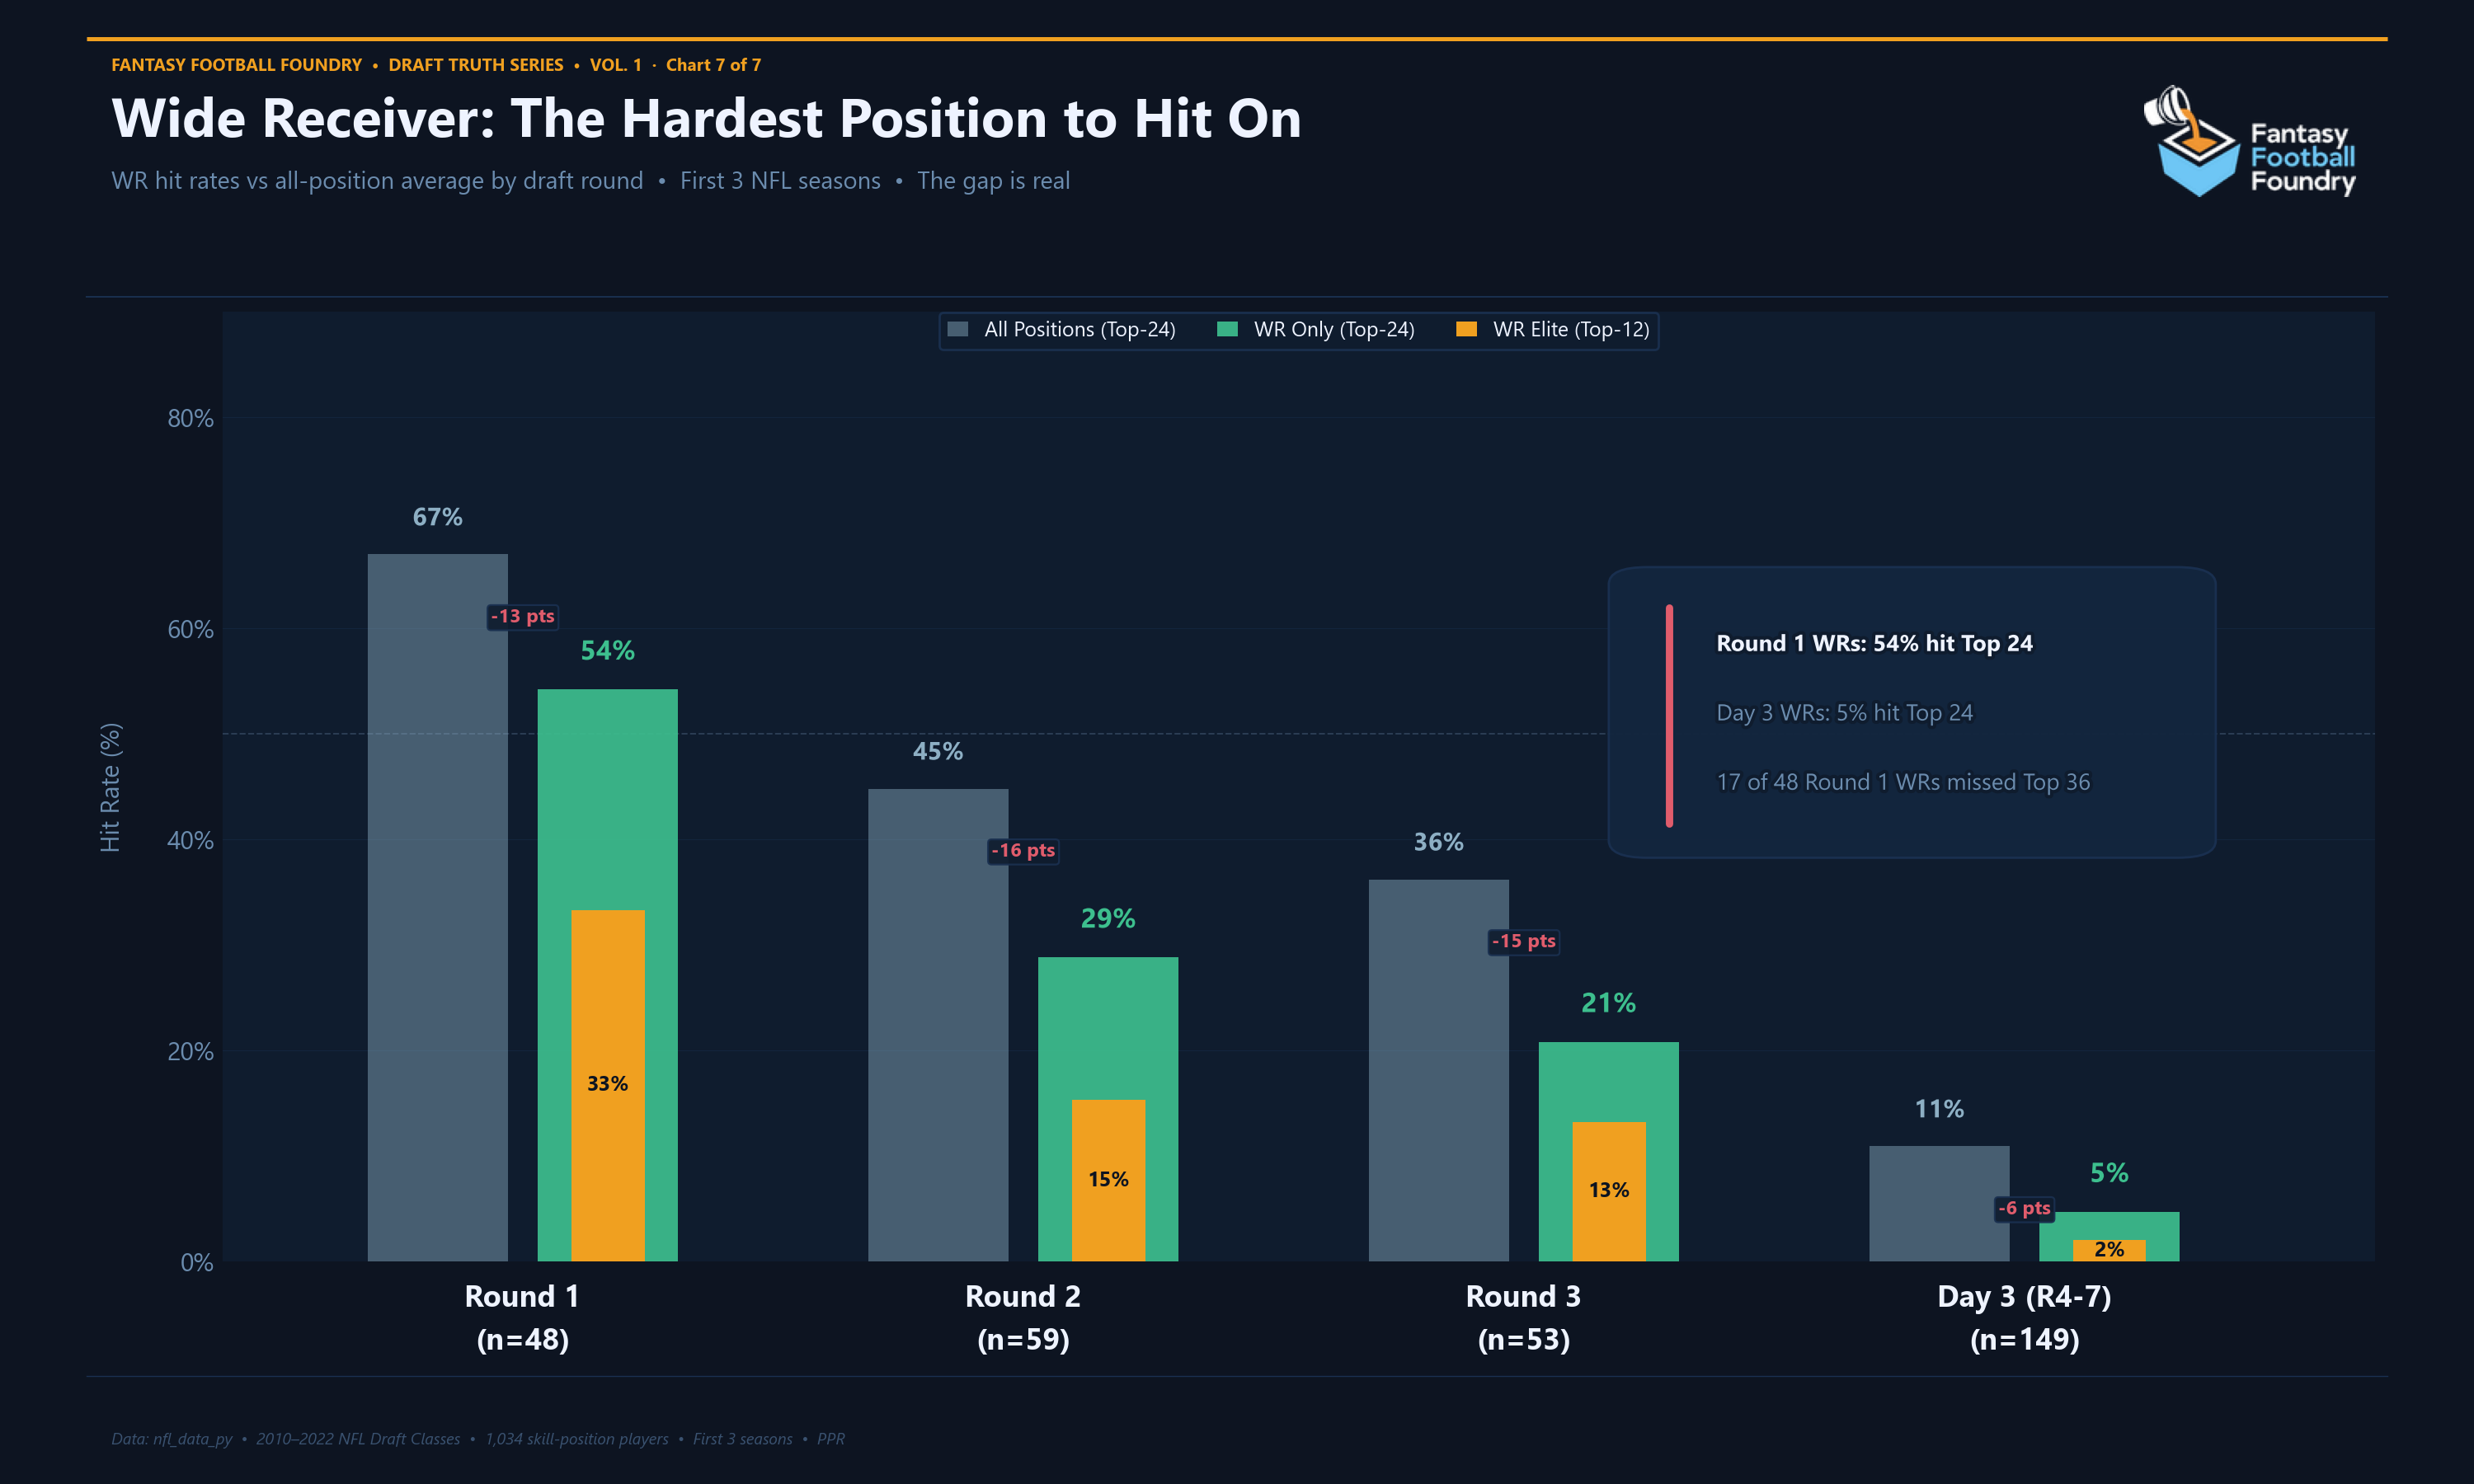
When you compare WR hit rates to the all-position average, the gap is stark at every round:
- Round 1 WRs: 54% top-24 vs 67% all positions. A 13-point deficit.
- Round 2 WRs: 29% top-24 vs 45% all positions. A 16-point deficit.
- Day 3 WRs: 5% top-24 vs 11% all positions. Half the baseline.
And the Round 1 WR bust list in our data is a who's who of failed hype: Kevin White (pick #7, best fantasy rank #117), John Ross (#9, #75), Henry Ruggs III (#12, #86), Corey Coleman (#15, #80), Treylon Burks (#18, #81), Kadarius Toney (#20, #89), Jalen Reagor (#21, #90), Josh Doctson (#22, #55), Laquon Treadwell (#23, #92), Breshad Perriman (#26, #74), A.J. Jenkins (#30, #133).
17 of 48 Round 1 WRs in our data never became a top-36 wide receiver in their first three seasons. That's 35% of first-round picks at the position: complete misses. That's not outlier behavior. That's the position.
What This Means for How You Play
In dynasty startup drafts: Draft capital is the single most predictive variable when evaluating rookie picks. More than landing spot, more than college production, more than combine scores. Price it in explicitly. Don't discount it for a "better situation."
For wide receivers specifically: Build in the development timeline. A Round 1 WR producing at just 26% in Year 1 is the norm, not the exception. The real evaluation window opens in Year 2 and Year 3, when that rate climbs to 35% and then 42%.
For QBs and RBs: These positions respond to draft capital more immediately. Nearly half of Round 1 QBs and 61% of Round 1 RBs hit top-24 as rookies. A Day 3 RB in a featured role can hit, but the baseline odds are 14%.
For tight ends: The Year 3 breakout is structural, not anecdotal. Round 1 TEs climb from 50% in Year 1 to 89% by Year 3. A Round 1-2 TE entering Year 3 is often underpriced because the market reads "hasn't produced yet" instead of "right on the development curve."
On the "landing spot" obsession: Situation matters for individual outcomes. But draft capital predicts outcomes better across the population. A Day 3 WR going to the best offense in the league is still a 5% proposition. Landing spot explains individual cases. The data explains the system.
The Outliers are the Whole Point
The Day 3 stars: Tyreek Hill (pick #165), George Kittle (#146), Dak Prescott (#135), Aaron Jones (#182), Devonta Freeman (#103), Amon-Ra St. Brown (#112), Brock Purdy (#262), are exactly why people keep chasing Day 3 value. The ones who hit, hit hard. Purdy was the 262nd pick and became a top-6 QB. Hill was the 165th pick and became the best receiver in football.
These players exist. The data doesn't deny that. What the data says is: for every Tyreek Hill, there are roughly nineteen Day 3 WRs who never became fantasy starters. You don't hear their names because they're not talked about. But they were real picks, with real hype, and they went nowhere.
Understanding the base rates is the edge. Not pretending the outliers are the rule.
The Foundry Take
Based on 13 years of NFL draft data:
- Pay up for Round 1 RBs and TEs. 79% and 100% top-24 rates, respectively. The hit rates justify the price. (TE note: n=10, small sample.)
- Be selective on Round 1 WRs. 54% is a coin flip. Don't pay RB or TE prices for WR draft capital.
- Round 2 QBs remain undervalued in dynasty. 60% top-24 rate, the market often overweights landing spot over draft capital at QB.
- Hold Round 1 WRs through Year 3 before passing judgment. Only 26% produce as rookies. The development curve is long by design: 42% hit by Year 3.
- Treat Day 3 picks as lottery tickets, not value plays. Buy them cheap on price, not on narrative. Round 4 still has real players (15%). Rounds 6-7 are 6% odds.
- The Year 3 TE window is real. Round 1 TEs hit 89% by Year 3. Target Round 1-2 TEs entering their third season before the rest of the market acts.
By Fantasy Football Foundry | April 2026
Data: nfl_data_py | 1,034 skill-position players | 2010–2022 draft classes
First 3 NFL seasons per player | PPR scoring

Comments ()